IC Markets Home Sign in Web Trader Contact Us
IC Markets Social IC Markets Social

Information Hub for
Serious Traders

  • ABOUT US
  • OPEN LIVE ACCOUNT
  • OPEN DEMO ACCOUNT
  • TRADE NOW
  • VISIT OUR BLOG
IC Markets Social
  • ABOUT US
  • OPEN LIVE ACCOUNT
  • OPEN DEMO ACCOUNT
  • TRADE NOW
  • VISIT OUR BLOG
September 8, 2022Australian_Stocks_enIC Markets

Possible breach of support level by Hong Kong 50 Index

Hong Kong 50 Index is moving towards a support line which it has tested numerous times in the past. We have seen it retrace from this line before, so at this stage it isn’t clear whether it will breach this line or rebound as it did before. If Hong Kong 50 Index continues in its […]

Read more
September 8, 2022Australian_Stocks_enIC Markets

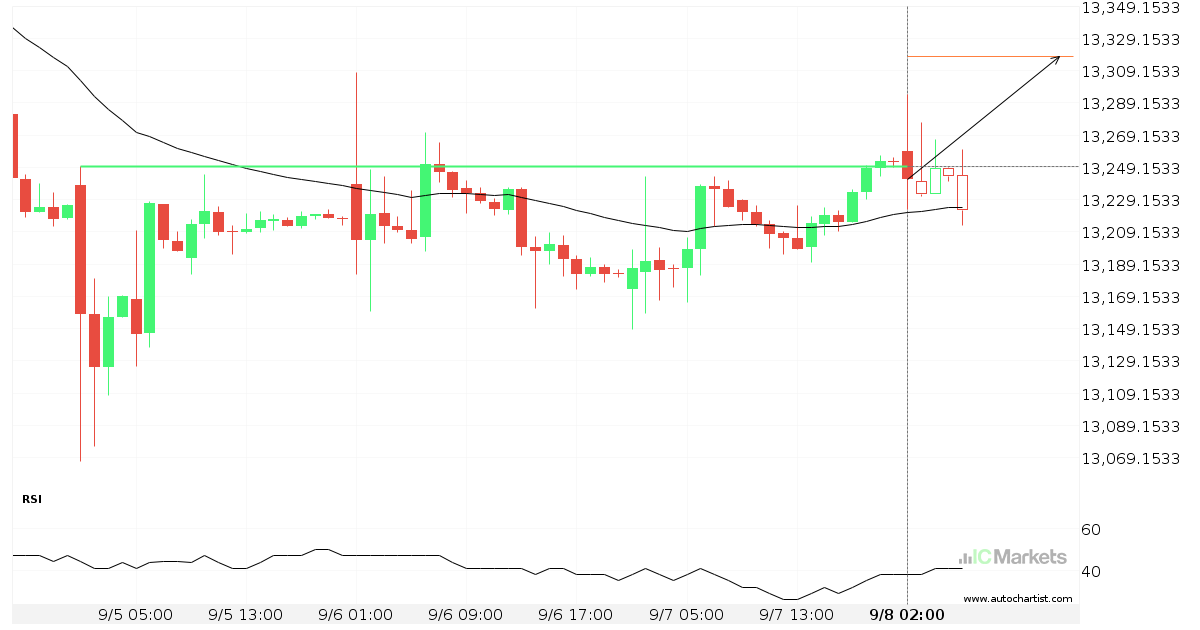
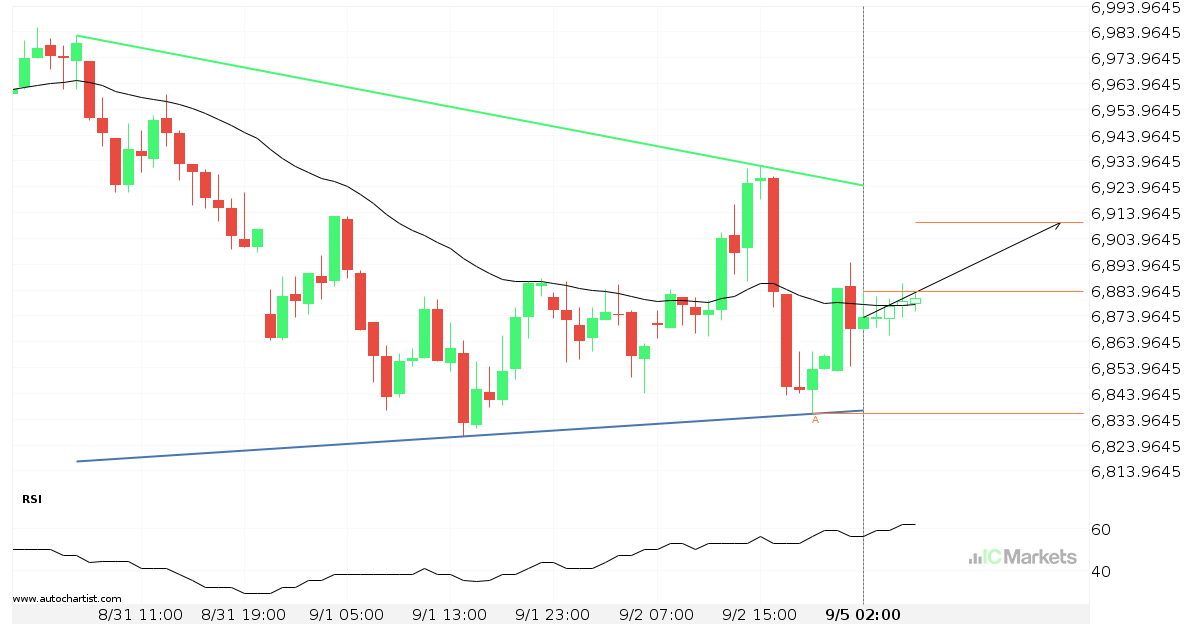
FTSE China A50 Index broke through important 13249.3701 price line

FTSE China A50 Index has broken through a resistance line. It has touched this line numerous times in the last 4 days. This breakout shows a potential move to 13317.5557 within the next 10 hours. Because we have seen it retrace from this level in the past, one should wait for confirmation of the breakout.

Read more
September 7, 2022Australian_Stocks_enIC Markets

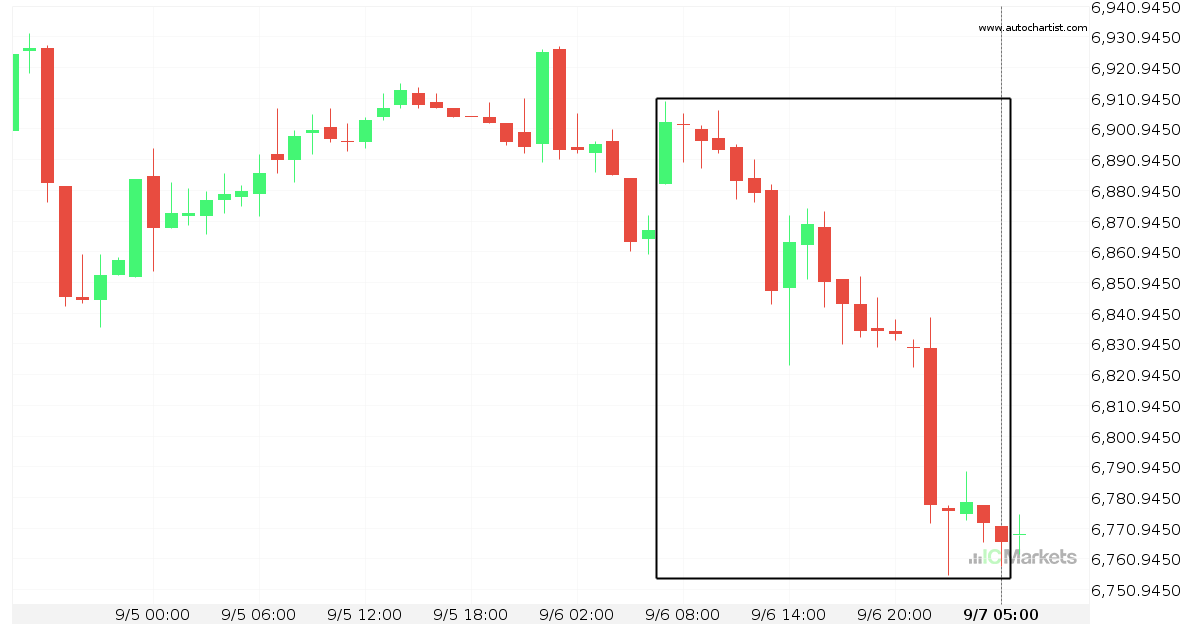
Australia 200 Index experienced an exceptionally large movement

For those of you that don’t believe in trends, this may be an opportunity to take advantage of an exceptional 1.98% move on Australia 200 Index. The movement has happened over the last 22 hours. For those trend followers among you, you may think about riding this possible trend.

Read more
September 6, 2022Australian_Stocks_enIC Markets

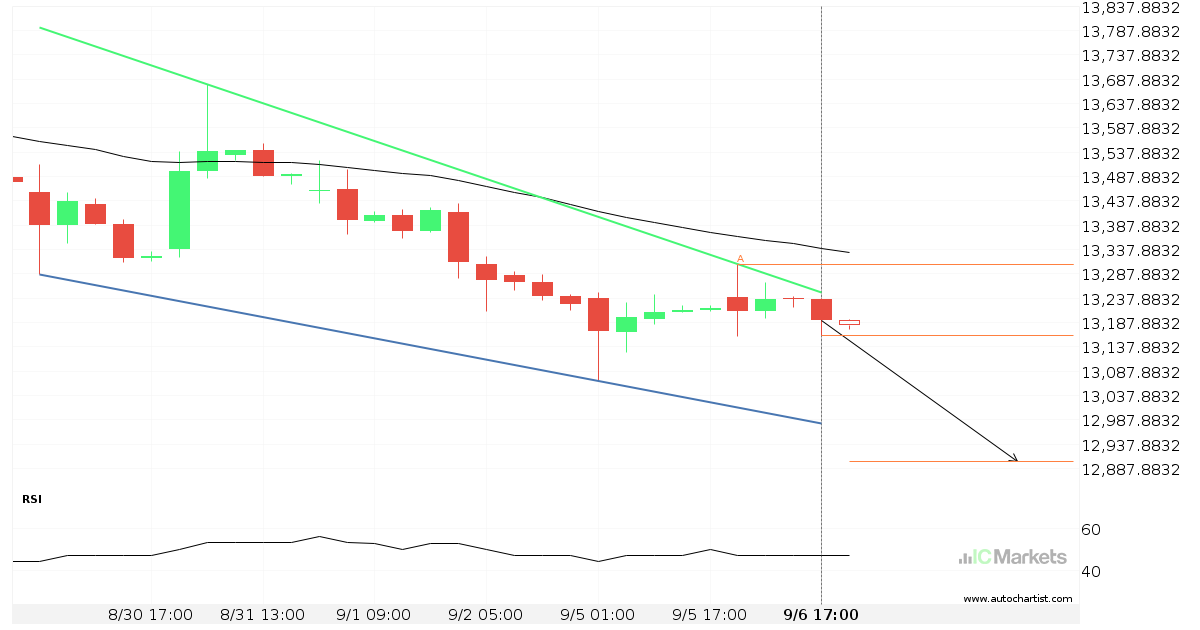
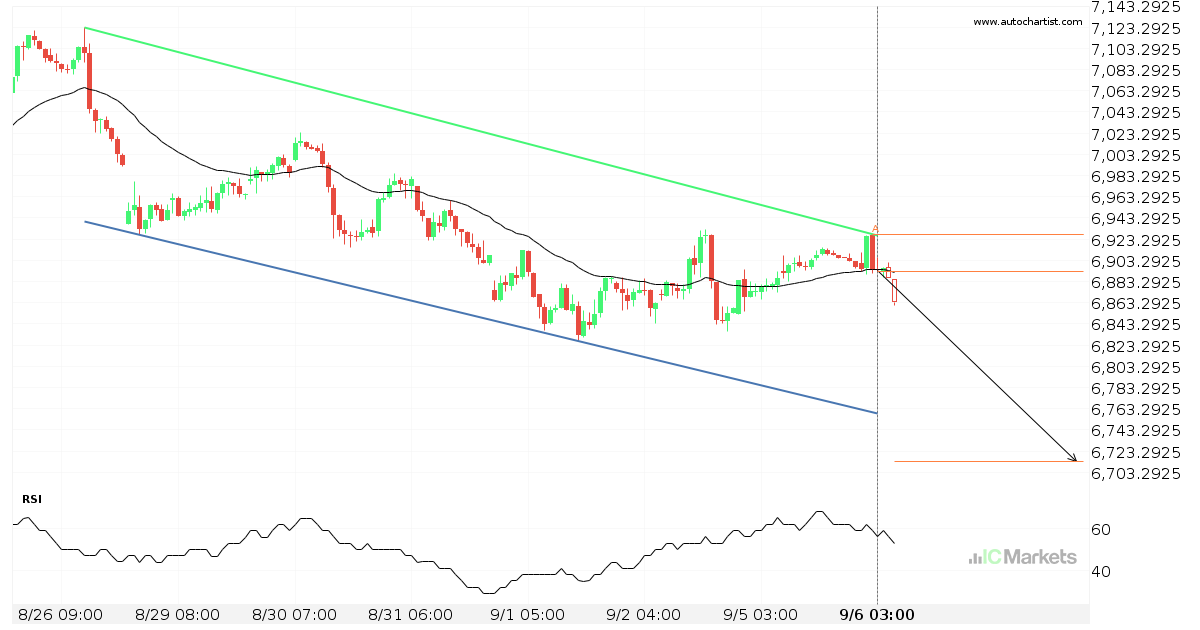
FTSE China A50 Index approaching support of a Falling Wedge

FTSE China A50 Index is approaching the support line of a Falling Wedge. It has touched this line numerous times in the last 8 days. If it tests this line again, it should do so in the next 2 days.

Read more
September 6, 2022Australian_Stocks_enIC Markets

Possible breach of support level by Australia 200 Index

Australia 200 Index is moving towards a support line which it has tested numerous times in the past. We have seen it retrace from this line before, so at this stage it isn’t clear whether it will breach this line or rebound as it did before. If Australia 200 Index continues in its current trajectory, […]

Read more
September 5, 2022Australian_Stocks_enIC Markets

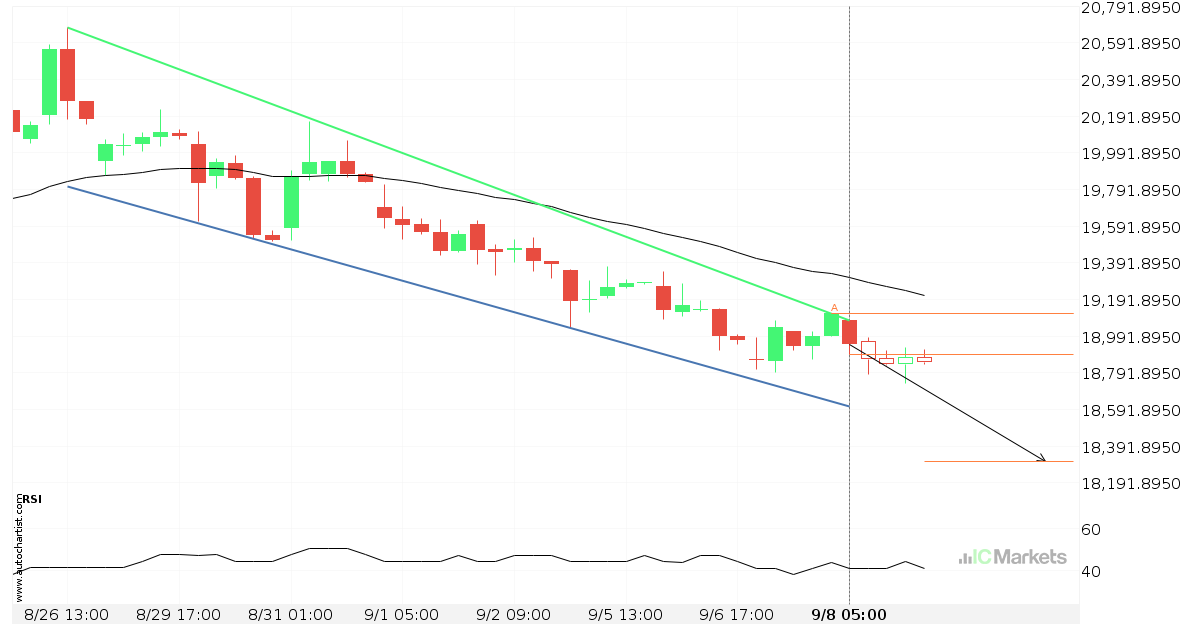
Possible start of a bearish trend on Hong Kong 50 Index

Hong Kong 50 Index has broken through a line of 19464.1992. If this breakout holds true, we could see the price of Hong Kong 50 Index heading towards 18969.6797 within the next 2 days. But don’t be so quick to trade, it has tested this line numerous times in the past, so you should probably […]

Read more
September 5, 2022Australian_Stocks_enIC Markets

Will Australia 200 Index have enough momentum to break resistance?

Australia 200 Index is heading towards the resistance line of a Triangle and could reach this point within the next 15 hours. It has tested this line numerous times in the past, and this time could be no different from the past, ending in a rebound instead of a breakout. If the breakout doesn’t happen, […]

Read more
September 4, 2022Australian_Stocks_enIC Markets

Possible breach of support level by Hong Kong 50 Index

Hong Kong 50 Index is moving towards a support line which it has tested numerous times in the past. We have seen it retrace from this line before, so at this stage it isn’t clear whether it will breach this line or rebound as it did before. If Hong Kong 50 Index continues in its […]

Read more
September 2, 2022Australian_Stocks_enIC Markets

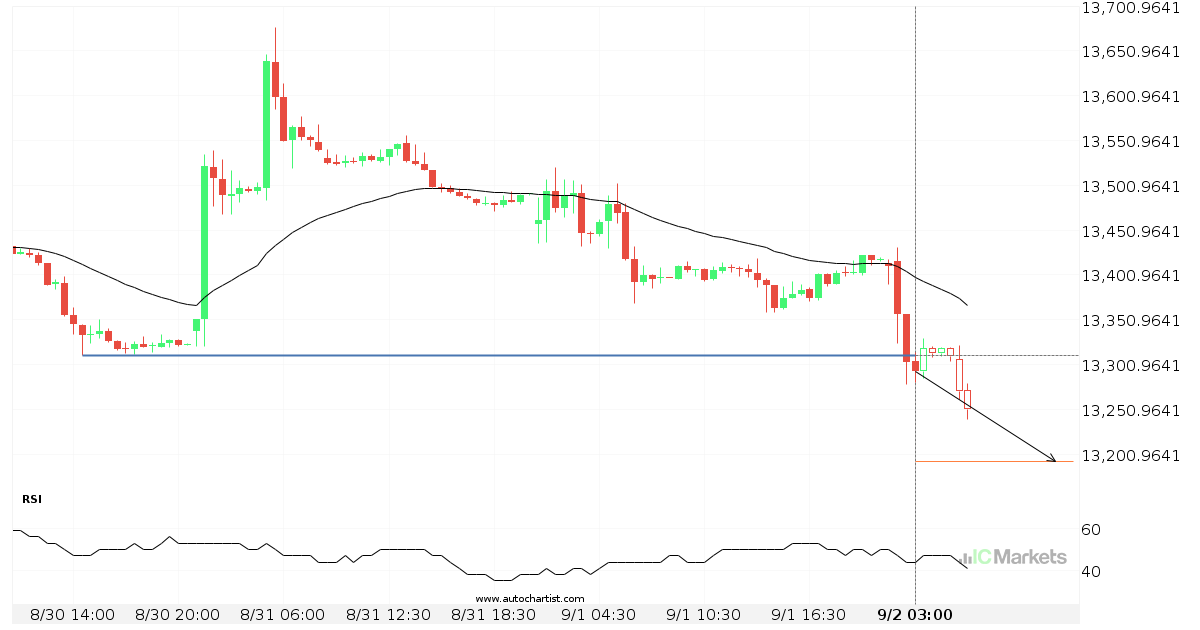
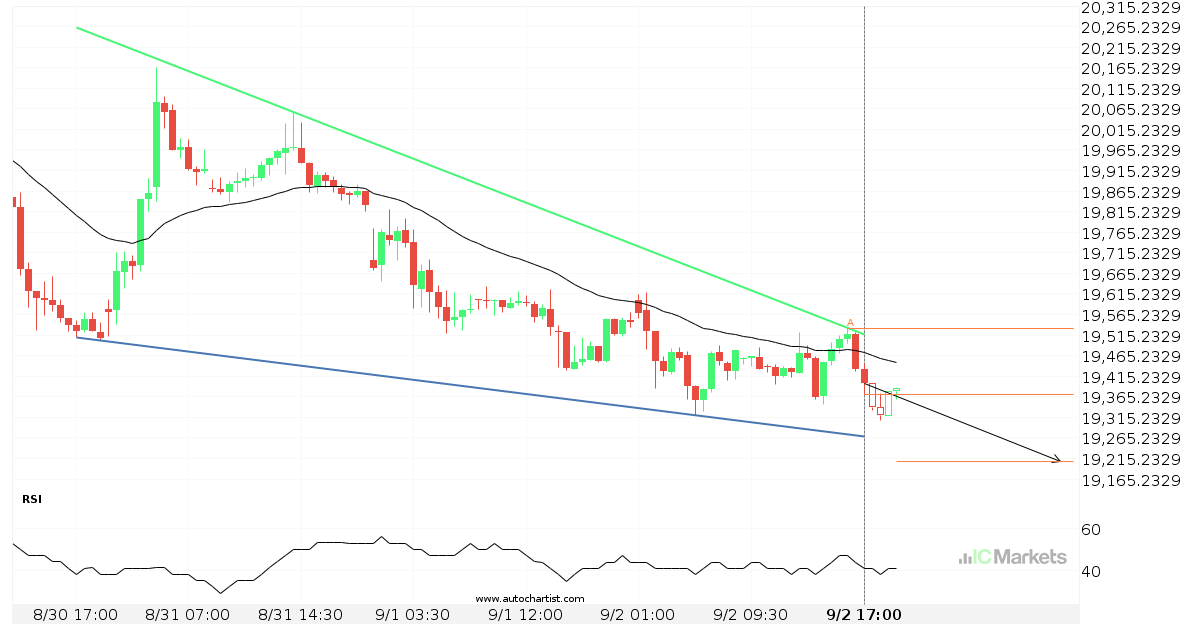
Possible start of a bearish trend on FTSE China A50 Index

FTSE China A50 Index has broken through a line of 13311.5098. If this breakout holds true, we could see the price of FTSE China A50 Index heading towards 13193.0986 within the next 8 hours. But don’t be so quick to trade, it has tested this line numerous times in the past, so you should probably […]

Read more
September 1, 2022Australian_Stocks_enIC Markets

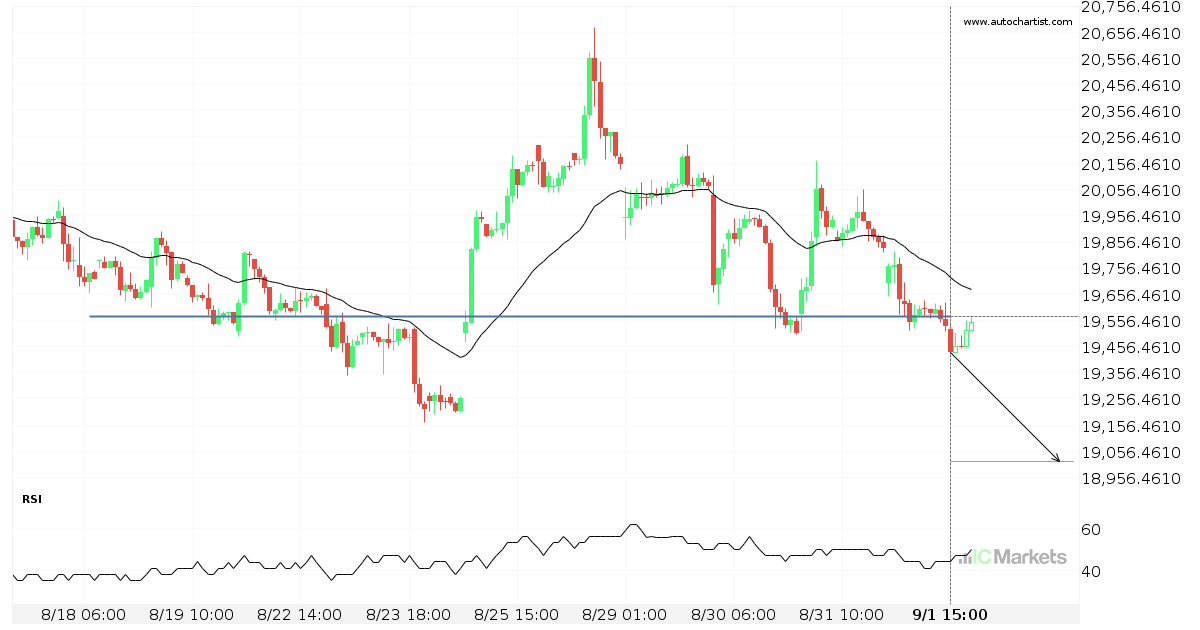
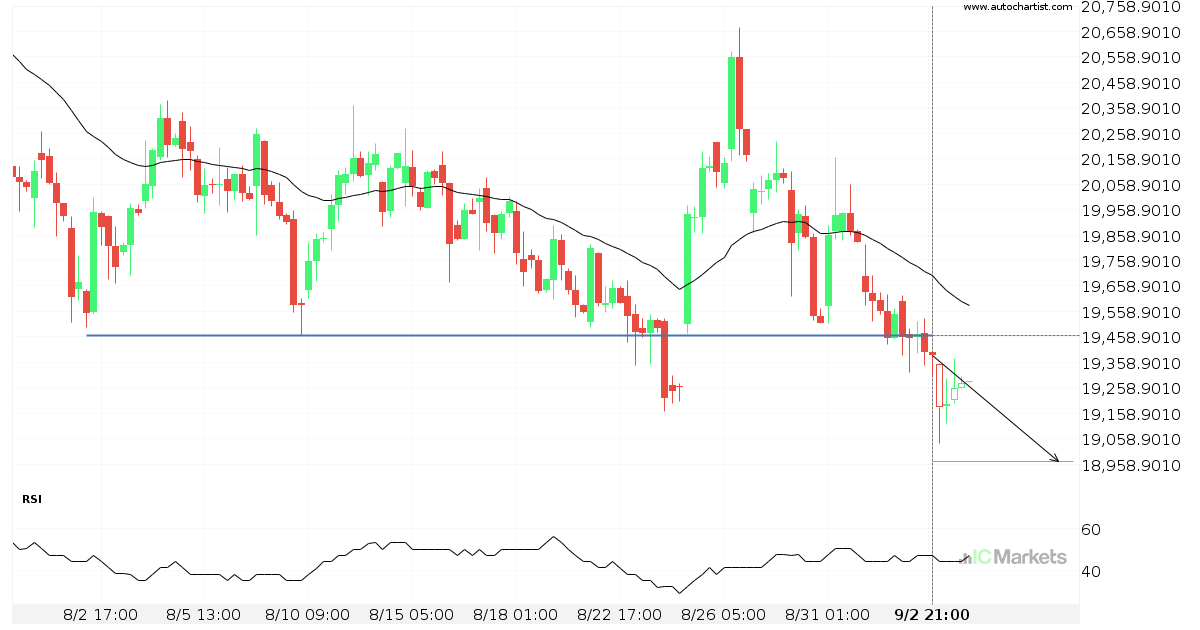
Hong Kong 50 Index broke through important 19570.3008 price line

Hong Kong 50 Index has broken through a support line. It has touched this line numerous times in the last 15 days. This breakout shows a potential move to 19018.4805 within the next 2 days. Because we have seen it retrace from this level in the past, one should wait for confirmation of the breakout.

Read more
  • 1
  • 2
  • 3
  • …
  • 63
  • 64
  • 65
  • 66
  • 67
  • 68
  • 69
  • …
  • 153
  • 154
  • 155

Recent Posts

  • UK 100 Index – المستوى الرئيسي – مقاومة
  • Gold vs US Dollar – نموذج الرسم البياني – قناة صاعدة
  • US Wall Street 30 Index – المستوى الرئيسي – مقاومة
  • Brent Oil vs US Dollar – نموذج الرسم البياني – قناة صاعدة
  • Brent Oil vs US Dollar – نموذج الرسم البياني – قناة صاعدة

Recent Comments

    Translation


     Edit Translation

    Trade with

    a market leader you can rely on

    Open Trading Account Try a Free Demo

    Forex Trading

    • Accounts Overview
    • Open an Account
    • Launch Web Trader

    Trading Specifications

    • Spreads and Commissions
    • Range of Market
    • Trading Hours
    • Funding
    • Withdrawal

    About IC Markets

    • Help Center
    • Why IC Markets
    • Regulation
    • Legal Documents
    • Contact Us


    Forex Trading

    • Accounts Overview
    • Open an Account
    • Launch Web Trader

    Trading Specifications

    • Spreads and Commissions
    • Range of Market
    • Trading Hours
    • Funding
    • Withdrawal

    About IC Markets

    • Chat with a Specialist 24/7
    • Why IC Markets
    • Regulation
    • Legal Documents
    • Contact Us

    Disclaimer: This material is marketing material where all marketing material is published for informational purposes only. This material does not contain and should not be considered as containing - investment advice and recommendations, or suggestions for performing any actions with financial instruments. The built-in widgets belong to their external independent authors, and IC Markets is not responsible for their content and their impact on trade.

    All content rights reserved. Opinions of the authors may not coincide with the opinion of the blog editors. When copying materials from this site or connecting to an RSS feed to republish our articles, a link to IC Markets or attribution in the format ‘IC Markets Blog’ is required. For general questions, please contact the editorial office via the form on the Contact us page.

    Risk Warning: Trading Derivatives carries a high level of risk to your capital and you should only trade with money you can afford to lose. Trading Derivatives may not be suitable for all investors, so please ensure that you fully understand the risks involved and seek independent advice if necessary. A Product Disclosure Statement (PDS) should be considered before entering into a transaction with us.

    The contents of this page are general information only and does not take into account your personal situation, financial objectives or needs. It is up to you to make sure the products that we offer suit your specific needs. You should not trade with us unless you understand the features and risks of the products that we offer. This means that you might need to seek independent advice before you start trading with us.

    © 2022 Raw Trading Ltd | All rights reserved.
    • Sample Page